Research-use-only context. This article summarizes published third-party scientific literature and laboratory practice. It is not medical advice, not a therapeutic or performance claim, and not a usage guide. US Prime Peptides products are supplied strictly for in vitro laboratory research and are not for human or veterinary use.
"Purity 99.2% by HPLC" is the most quoted line on a research-peptide certificate and the most misread. This article explains how reversed-phase HPLC separates a peptide from its relatives, how the area-percent figure is calculated, why it is not the same as peptide content, and how the detection wavelength and detector response quietly shape the number.
What HPLC purity actually measures
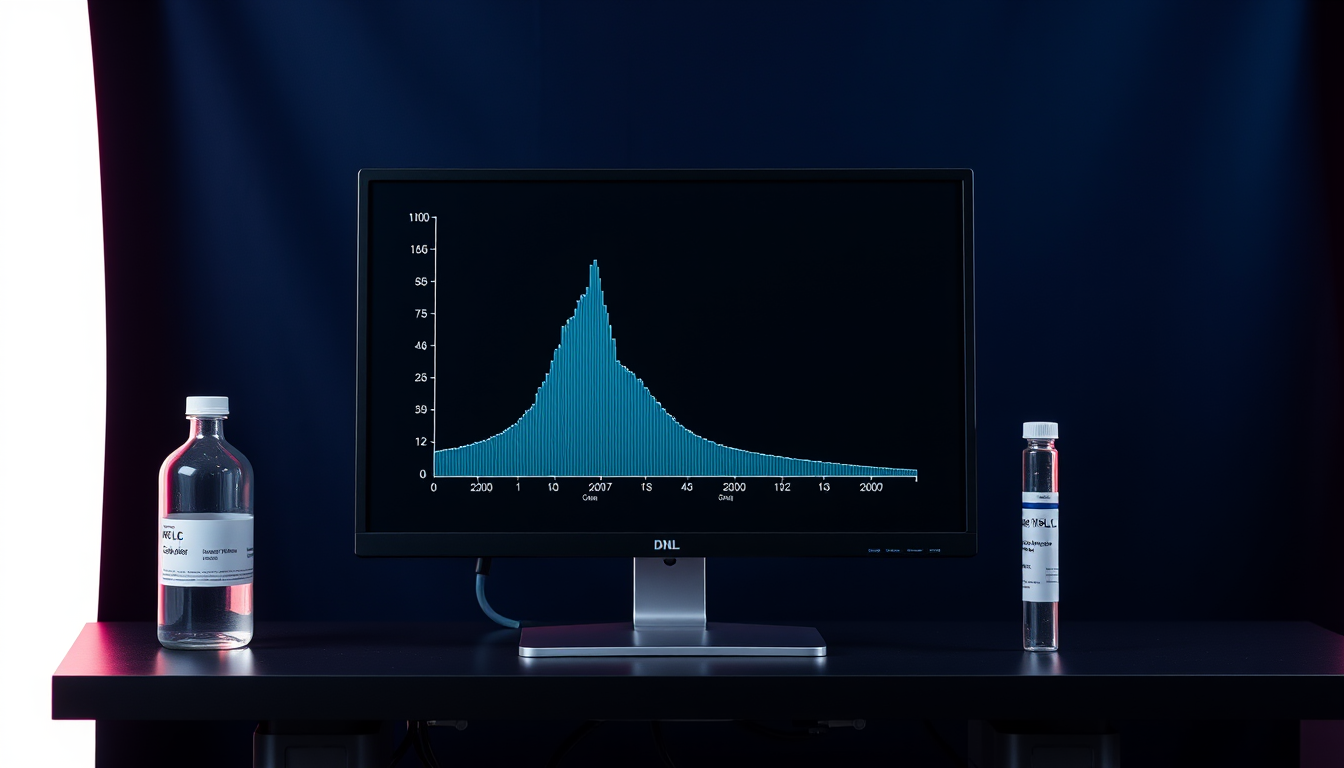
HPLC purity is the share of total chromatographic peak area that belongs to the main peak, measured at one detection wavelength, in one run, on one sample. USP General Chapter <621> calls this quantitation by area normalization: the percentage of a component equals its peak area divided by the sum of the areas of all peaks counted, times 100, after excluding peaks from the solvent, reagents, and mobile phase and any peak at or below the disregard limit. The number therefore describes the peptide relative to other species that absorb light at that wavelength and elute under those conditions. It says nothing about material the detector cannot see.
That framing matters because a peptide powder is never only peptide. Counter-ions such as trifluoroacetate or acetate, bound water, and inorganic salts are all present in the lyophilized mass and all transparent to a UV detector at the wavelengths used for peptide work. A 99% area-percent result is consistent with a powder that is 70% to 85% peptide by mass. The mass question is answered by a separate measurement, covered in net peptide content vs purity, and a careful certificate reports both.
Reversed-phase chromatography in plain terms
Reversed-phase HPLC separates peptides by hydrophobicity. The column is packed with silica particles carrying bonded alkyl chains, most often C18, and the sample is carried through in a mobile phase that starts mostly aqueous and becomes steadily richer in an organic solvent, usually acetonitrile, over a programmed gradient. Each peptide clings to the hydrophobic surface until the organic fraction is high enough to release it, so more hydrophobic species leave the column later. An acid modifier, typically 0.1% trifluoroacetic acid, keeps carboxyl groups protonated and sharpens peaks by pairing with basic residues.
Three descriptors from USP <621> appear on method summaries. Retention time is the time from sample introduction to the peak maximum; it is characteristic of a compound under fixed conditions but not unique, which is why the chapter counts a retention-time match as only partial evidence of identity. Resolution between two peaks is calculated from the difference in their retention times divided by the average of their baseline widths, and a resolution of 1.5 or more means the peaks are essentially baseline separated. The tailing factor, measured at 5% of peak height, equals 1 for a symmetrical peak and grows as the trailing edge stretches; as symmetry degrades, integration becomes less reliable. Reading these features on a real trace is the subject of how to read an HPLC chromatogram.
How area percent is computed
The integration software draws a baseline under the trace, marks the start and end of each peak, and sums the detector signal between them to produce an area. The main peak's area divided by the total of all qualifying areas is the purity figure. Two rules from USP <621> govern what qualifies. First, peaks at or below the disregard limit, generally 0.05% for impurity tests, are dropped from the total. Second, peaks that are not fully separated from the main peak, such as shoulders, are still integrated, preferably by extrapolating the valley between them or skimming a tangent, rather than being folded into the main peak.
A worked example shows how sensitive the figure is to those choices. Suppose a run gives the areas in the table below.
| Peak | Retention (min) | Area (mAU·s) | Share of total | Counted? |
|---|---|---|---|---|
| Solvent front | 1.2 | 310 | — | No: mobile-phase peak, excluded |
| Deletion sequence | 14.1 | 42 | 0.42% | Yes |
| Main peptide | 15.0 | 9,870 | 98.7% | Yes |
| Shoulder (oxidized form) | 15.3 | 61 | 0.61% | Yes, by valley-to-valley integration |
| Late-eluting dimer | 18.9 | 27 | 0.27% | Yes |
| Trace peak | 21.0 | 4 | 0.04% | No: below the 0.05% disregard limit |
Counting the four qualifying peaks gives a total of 10,000 and a main-peak purity of 98.7%. If the analyst had merged the shoulder into the main peak, the result would read 99.3%. If the solvent front had been included in the total, it would read 95.7%. None of these is fraud; they are integration decisions, and a certificate that names its disregard limit and integration approach lets a reader judge the figure.
Why 99% purity is not 99% content
Area percent compares UV-absorbing species to one another. The lyophilized mass also contains species that do not absorb and are never on the chromatogram. A 2018 Analytical and Bioanalytical Chemistry study by Melanson and colleagues on a candidate angiotensin II reference material quantified the trifluoroacetate counter-ion by fluorine-19 NMR at nearly 25% of the total mass, a fraction that an HPLC purity figure would never reveal. Water bound to the cake and residual buffer salts add more invisible mass.
The regulatory language keeps the two ideas separate for exactly this reason. In a 2019 multi-laboratory study, Li and colleagues at USP described how peptide reference-standard content is assigned by an HPLC assay against an external standard whose purity was itself fixed by mass balance, and compared that approach with quantitative NMR and amino acid analysis for oxytocin. The chromatographic purity of a standard and the content value assigned to it are different numbers with different uncertainties. On a certificate, "purity (HPLC)" answers "how much of the peptide-related material is the right peptide?", and "peptide content" answers "how much of the powder is peptide at all?".
Detection wavelength and response factors
Peptide purity is usually measured between 210 and 220 nm, where the peptide bond itself absorbs, so every residue contributes signal. Some laboratories report at 254 or 280 nm instead, where only aromatic side chains (tryptophan, tyrosine, and to a lesser degree phenylalanine) absorb. The choice changes the result. An impurity that lacks an aromatic residue is nearly invisible at 280 nm and would be under-counted, while a short deletion sequence might be over-represented at 214 nm relative to its mass if it retains more bonds per unit mass than average. The wavelength on the certificate is therefore part of the result, not a footnote.
The deeper assumption in area percent is that each species produces the same detector response per unit mass. That is the relative response factor (RRF), and USP <621> calls for correction factors when an impurity's response factor falls outside 0.8 to 1.2. A 2025 Analytical Chemistry perspective by Kuril argued that defaulting every peptide impurity's RRF to 1.0 over- or under-estimates impurities that arise from insertion, truncation, deamidation, isomerization, and oxidation, because those changes alter both mass and absorptivity. Measuring RRFs is not trivial: a 2002 Journal of Pharmaceutical and Biomedical Analysis paper by Nussbaum and colleagues paired a chemiluminescent nitrogen-specific detector with a UV detector to derive relative UV response factors online, without isolating each impurity. For most research certificates, RRF correction is not performed, which is one more reason to read area percent as a method-dependent comparison rather than an absolute mass fraction.
What the method cannot separate
Area percent reports only what the column resolves. Species that co-elute with the main peak are counted as main peak. The most important examples for synthetic peptides are diastereomers formed by racemization during synthesis, which often differ only slightly in retention, and isobaric impurities such as a deamidated form whose mass shift of one dalton may not move the peak under a routine gradient. A single reversed-phase run also cannot distinguish a D-amino-acid substitution from the all-L sequence by mass, so identity by mass spectrometry and purity by HPLC answer separate questions, as discussed in LC-MS identity confirmation.
Orthogonal methods exist to fill the gap. Zeng and colleagues at the FDA, writing in the AAPS Journal in 2015, developed a liquid chromatography high-resolution mass spectrometry method on salmon calcitonin, bivalirudin, and exenatide that detected related impurities below 0.1% of the main component with linear response and intra-assay relative standard deviations under 10%. Li and colleagues at the BIPM, in Analytical and Bioanalytical Chemistry in 2018, identified and quantified structurally related impurities in synthetic human C-peptide by the same combination of chromatography and high-resolution tandem MS. Huo and colleagues applied HPLC-QTOF-MS/MS to characterize related impurities of the antimicrobial peptide Cbf-14 in 2022. In each case the mass spectrometer identified what the UV trace could only count.
Reading the purity line on a certificate
A purity line that can be interpreted names the method and its conditions: column chemistry and dimensions, mobile phases and gradient, flow rate, detection wavelength, run time, and the disregard limit. It gives the main-peak percentage, lists the largest individual impurity, and reports the sum of impurities. Where the laboratory validated the method, the summary should refer to USP <1225> or ICH Q2(R2), which for a quantitative impurity procedure means accuracy, precision, specificity, quantitation limit, linearity, and range were established. A line that reads only "Purity: 99%" with no conditions is a number without a method, and the sections above explain why the same powder could legitimately produce several different numbers.
A reasonable reading order is: check the wavelength, check the disregard limit, look at the largest impurity, and only then look at the headline figure. Then move to the content line, because that is where the powder's actual peptide mass is reported.
Frequently Asked Questions
What does HPLC purity mean on a peptide COA?
It is the main peak's percentage of the total integrated peak area in a reversed-phase HPLC run at a stated UV wavelength, after excluding solvent peaks and peaks below the disregard limit. It compares the peptide with other UV-absorbing species in the sample and does not measure counter-ions, water, or salts.
Is 99% HPLC purity the same as 99% peptide content?
No. Purity is a relative share of chromatographic area; content is the mass fraction of peptide in the powder, measured by amino acid analysis, UV absorbance, or quantitative NMR. Counter-ions and water can make up 10% to 25% of the lyophilized mass, so content is usually well below the purity figure.
Why does the detection wavelength matter for peptide purity?
At 210 to 220 nm the peptide bond absorbs, so all peptide species contribute signal roughly in proportion to chain length. At 254 or 280 nm only aromatic residues absorb, so impurities without tryptophan or tyrosine are under-counted. Two laboratories using different wavelengths can report different purity values for the same lot.
What is a relative response factor in HPLC?
It is the ratio of an impurity's detector response per unit amount to that of the main compound. Area percent assumes the ratio is 1.0, and USP <621> asks for correction factors when it falls outside 0.8 to 1.2. Peptide impurities with altered chromophores or chain lengths frequently have ratios that differ from 1.0.
Citations
- United States Pharmacopeia. General Chapter <621> Chromatography. USP-NF. doi.usp.org/USPNF/USPNF_M99380_80201_01.html
- United States Pharmacopeia. General Chapter <1225> Validation of Compendial Procedures. USP-NF. doi.usp.org/USPNF/USPNF_M99945_40101_01.html
- FDA. Q2(R2) Validation of Analytical Procedures: Guidance for Industry. March 2024. fda.gov
- Kumar Kuril A. The Critical Need for Implementing RRF in the Accurate Assessment of Impurities in Peptide Therapeutics. Anal Chem. 2025;97:12480-12485. PMID 40499007
- Nussbaum MA, Baertschi SW, Jansen PJ. Determination of relative UV response factors for HPLC by use of a chemiluminescent nitrogen-specific detector. J Pharm Biomed Anal. 2002;27:983-993. PMID 11836061
- Melanson JE, Thibeault MP, Stocks BB, Leek DM, McRae G, Meija J. Purity assignment for peptide certified reference materials by combining qNMR and LC-MS/MS amino acid analysis results: application to angiotensin II. Anal Bioanal Chem. 2018;410:6719-6731. PMID 30143839
- Li C, Bhavaraju S, Thibeault MP, et al. Survey of peptide quantification methods and comparison of their reproducibility: A case study using oxytocin. J Pharm Biomed Anal. 2019;166:105-112. PMID 30640042
- Zeng K, Geerlof-Vidavisky I, Gucinski A, Jiang X, Boyne MT. Liquid Chromatography-High Resolution Mass Spectrometry for Peptide Drug Quality Control. AAPS J. 2015;17:643-651. PMID 25716148
- Li M, Josephs RD, Daireaux A, et al. Identification and accurate quantification of structurally related peptide impurities in synthetic human C-peptide by liquid chromatography-high resolution mass spectrometry. Anal Bioanal Chem. 2018;410:5059-5070. PMID 29862433
- Huo Y, Xu K, Lu Y, et al. Characterization of structurally related peptide impurities using HPLC-QTOF-MS/MS: application to Cbf-14, a novel antimicrobial peptide. Anal Bioanal Chem. 2022;414:6485-6495. PMID 35840670
This article is for laboratory research reference only. US Prime Peptides products are supplied strictly for in vitro research. Not for human consumption.
Related research
- How to Vet a Research Peptide Vendor: A 12-Point Checklist
- What a Lot Number Is For, and How to Match a Vial to Its Certificate
- Net Peptide Content vs Purity: Why a 99% Pure Vial Can Hold Less Peptide Than You Think
- How to Read a Peptide Certificate of Analysis, Line by Line
- Endotoxin Testing Explained: LAL, Recombinant Factor C, and Reading EU per mg
Compliance Notice: US Prime Peptides products are supplied strictly for laboratory and academic research purposes only. They are not intended for human or veterinary consumption, diagnosis, treatment, or prevention of any disease. All content on this page is educational in nature and does not constitute medical advice or product claims. Researchers are responsible for handling these compounds in accordance with their institution’s safety protocols and applicable laws.