Research-use-only context. This article summarizes published third-party scientific literature and laboratory practice. It is not medical advice, not a therapeutic or performance claim, and not a usage guide. US Prime Peptides products are supplied strictly for in vitro laboratory research and are not for human or veterinary use.
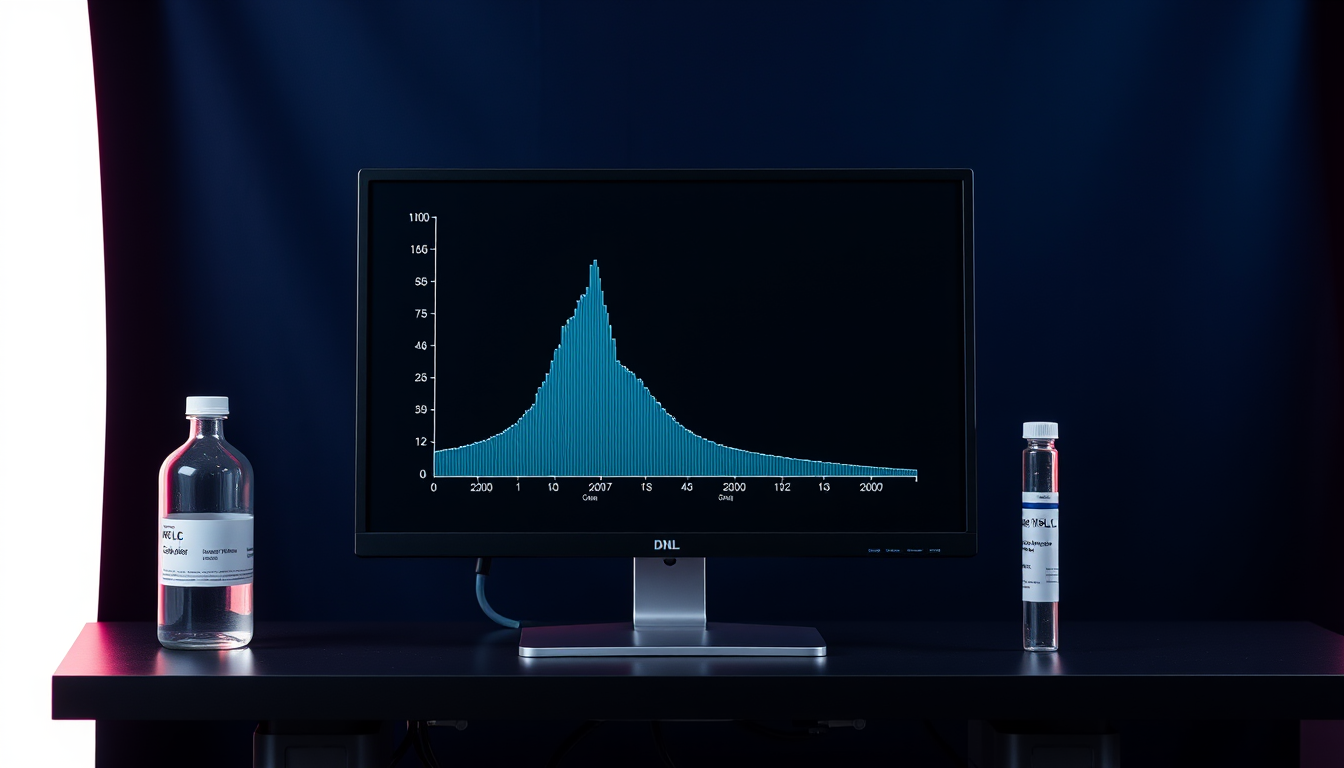
The chromatogram attached to a peptide certificate is a graph of detector signal against time, and almost everything the purity number means is visible in it if you know where to look. This article walks through the axes, the main peak and its retention time, the families of impurity peaks a synthetic peptide can show and where each tends to elute, the artifacts that come from the instrument rather than the sample, and the questions to ask when a shoulder appears on the main peak.
What the axes and the baseline are telling you
The horizontal axis is time in minutes after the sample is loaded onto the column; the vertical axis is detector response, usually UV absorbance in milli-absorbance units (mAU) at 210 to 220 nm, where the peptide bond absorbs, or at 280 nm if the sequence contains tryptophan or tyrosine. Peptides are separated by reverse-phase chromatography: the sample is loaded onto a C18 or C8 column in water with 0.1% trifluoroacetic acid or formic acid, and an increasing proportion of acetonitrile elutes species in order of hydrophobicity, least hydrophobic first.
The baseline is the signal when nothing is eluting. On a gradient it drifts upward because acetonitrile and TFA absorb slightly at low wavelength, and a well-run method includes a blank run so that drift and system peaks can be recognized and subtracted. Near the start of the trace sits the solvent front, a cluster of early peaks from unretained material, including salts and the sample solvent; it is excluded from purity integration. The main peak is the tallest peak at the retention time of the target peptide, established with a reference standard or by mass spectrometry. Purity in area percent is the main peak's area divided by the total integrated area of all peptide-related peaks, a calculation and its limits explained in HPLC purity: what area percent does and does not tell you.
The main peak: retention time, shape, and symmetry
A main peak should be at the expected retention time, symmetrical, and resolved from its neighbors down to baseline. Retention time is reproducible to a few hundredths of a minute on one system but shifts between columns, gradients and instruments, so identity comes from matching a standard run on the same system or from the mass spectrum, as described in LC-MS identity confirmation, not from the time value alone.
Shape carries information. Tailing (a drawn-out trailing edge) usually indicates secondary interactions with residual silanols on the column or column overload; fronting (a drawn-out leading edge) usually indicates overload or a sample solvent stronger than the mobile phase. A shoulder, a bump on either flank that does not return to baseline, means a second species is eluting almost with the main peak. Whether the shoulder is integrated as a separate peak or absorbed into the main peak is decided by the integration parameters, which is why two laboratories can report different purity values for one vial, a problem discussed in why a second laboratory matters. Peak purity, the question of whether anything hides under the main peak, cannot be settled from a single UV trace. Petersson, Stoll and colleagues published a two-part strategy in the Journal of Chromatography A in 2023 using two-dimensional liquid chromatography with mass spectrometry, in which a second column of different selectivity is used to pull apart species, including D/L isomers, that co-elute with the target on the first.
Impurity peaks a synthetic peptide can show
Most impurity peaks in a synthetic peptide are sequence relatives created during solid-phase synthesis, cleavage or storage, and each family has a characteristic mass difference and a typical position relative to the main peak. D'Hondt and colleagues' 2014 review in the Journal of Pharmaceutical and Biomedical Analysis organized them by origin: deletion and insertion of residues from incomplete deprotection or excess reagent, racemization during Fmoc removal giving diastereomers, incomplete side-chain deprotection leaving protecting-group adducts, side reactions of unprotected side chains, oxidation, and dimers and oligomers. Lian and colleagues' 2021 review in the Journal of the American Society for Mass Spectrometry added that structural isomers and epimers are the hardest class, because they share the target's mass.
| Peak family | Mass shift vs target | Typical position in reverse phase | Origin |
|---|---|---|---|
| Deletion sequence (one residue missing) | Minus one residue mass (for example -57 Da for Gly, -131 Da for Met) | Usually earlier if a hydrophobic residue is lost; later if a charged one is lost | Incomplete coupling or deprotection during synthesis |
| Insertion (double coupling) | Plus one residue mass (+57 Da for a second Gly) | Close to the main peak | Excess activated amino acid |
| Diastereomer (D-residue) | 0 Da (isobaric) | Shoulder or near-neighbor, before or after | Racemization during activation or Fmoc removal; D-amino acid in starting material |
| Methionine oxidation | +16 Da (sulfoxide), +32 Da (sulfone) | Earlier (more polar) | Air, peroxides, metals; can also form on the column |
| Deamidation (Asn to Asp or isoAsp) | +0.98 Da | Slightly earlier or later, often two peaks | Base exposure, storage in solution |
| Protecting-group adduct (tert-butyl) | +56 Da | Later (more hydrophobic) | Incomplete cleavage; tBu transfer to Cys or Tyr |
| Diketopiperazine / double deletion | Minus two residues | Earlier | Cyclization at a Pro-containing dipeptide stage |
| Disulfide dimer | Twice the mass minus 2 Da | Later, broad | Cysteine oxidation |
| Pyroglutamate, aspartimide | -17 Da, -18 Da | Near the main peak | N-terminal Gln or Glu cyclization; Asp-Gly succinimide |
Several of these were characterized in specific peptides. Wang and colleagues at Lilly reported in ACS Omega in 2022 that diketopiperazine formation during the synthesis of LY3298176 occurred mainly at a Pro-Pro-Ser intermediate and produced double-deletion impurities. Cheng and colleagues identified twenty-three related impurities in a thymalfasin reference material by LC-high-resolution MS in 2022, including deamidation, succinimide, insertion and deletion species, more than half traceable to the labile C-terminal asparagine. Liu and colleagues showed in the Journal of Pharmaceutical and Biomedical Analysis that apparent +56 Da peaks in a 36-residue peptide were mostly tert-butylation of cysteine and tyrosine during cleavage, with a pseudo-isobaric +57 Da double-glycine insertion overlapping them under low-resolution MS. Li and colleagues quantified eighteen related impurities totaling 31.1 mg/g in a synthetic oxytocin material in 2021. These studies are the evidence behind the table; they are also a reminder that a 99% main peak on a 220 nm trace can still contain an isobaric epimer that only a chiral method would reveal, as Strege and colleagues demonstrated with a chiral HPLC-MS/MS method sensitive to D-amino acid substitution at 0.1 to 1.0% in 2023.
Peaks that come from the instrument, not the sample
Not every peak is an impurity. Ghost peaks appear in blank gradient runs from contaminants accumulated on the column during equilibration and released as the acetonitrile rises; system peaks appear at the gradient's start or end from the refractive-index and absorbance change of the mobile phase itself; carryover peaks are residue from the previous sample. A trace reported without a blank run cannot distinguish these from sample impurities, and a laboratory that reports purity should be able to show the blank.
The column can also create impurities. Baumans and colleagues reported in 2021 that a methionine-containing synthetic peptide showed on-column oxidation reaching 56% on a one-year-old column with a long gradient, and 0% on a different stationary phase; the artefact decreased as sample load increased, consistent with a finite number of reactive sites in the packing. An unexpected +16 Da peak eluting just before the main peak is therefore a question to ask the laboratory before it is attributed to the lot. The practical checks are simple and are summarized below.
| Check | What to look for | Why it matters |
|---|---|---|
| Blank run | Peaks present in both blank and sample | Ghost and system peaks are not impurities |
| System suitability | Resolution, tailing factor and plate count for a standard | Confirms the column and gradient were performing |
| Integration events | Where the baseline was drawn under shoulders | Decides whether a shoulder counts against purity |
| Wavelength | 210 to 220 nm vs 280 nm | Non-aromatic impurities are invisible at 280 nm |
| Gradient slope | Minutes per percent acetonitrile | Shallow gradients resolve shoulders steep ones hide |
| Mass spectrum of each peak | Mass shift relative to target | Assigns the peak to a family in the table above |
A worked reading of a typical trace
Consider a trace that shows a solvent front at 1 to 2 minutes, a small peak at 11.8 minutes, a dominant peak at 12.4 minutes with a slight shoulder on its trailing edge, a small peak at 13.1 minutes, and a late broad hump at 18 minutes, with the main peak integrated at 98.7% of total area. The 11.8-minute peak eluting ahead of the target is most often a more polar relative, and a +16 Da mass would assign it to methionine sulfoxide, with the on-column artefact question to be checked against the laboratory's blank and column age. The trailing shoulder is the item to query: it may be a diastereomer, a deamidated form, or a deletion with similar hydrophobicity, and the integration log shows whether its area was counted. The 13.1-minute peak, later and therefore more hydrophobic, is a candidate for a protecting-group adduct (+56 Da) or a hydrophobic insertion. The broad late hump is typical of aggregates or a disulfide-linked dimer and may partly disappear when the sample is prepared fresh.
Three conclusions follow from this reading. The purity number is only as good as the integration that produced it, which is why the chromatogram, not the number, is the primary document. A mass spectrum per peak converts guesses into assignments, so a certificate that pairs the HPLC trace with LC-MS data is more informative than either alone. And area percent does not say how much peptide is in the vial, a separate quantity explained in net peptide content vs purity. The method-validation vocabulary that governs whether a chromatographic procedure is fit to produce the number, including specificity and resolution requirements, is defined in USP General Chapter <1225> and in ICH Q2(R2), which FDA adopted as guidance in 2024.
Frequently Asked Questions
What does the main peak on an HPLC chromatogram represent?
The main peak is the detector response of the target peptide eluting at its characteristic retention time under the stated column and gradient. Its area divided by the total integrated peptide-related area is the area-percent purity; its identity is confirmed by a reference standard run on the same system or by the mass spectrum, not by the retention time alone.
What causes a shoulder on the main peak in peptide HPLC?
A shoulder means a second species elutes almost with the target. In synthetic peptides the usual candidates are a diastereomer formed by racemization, a deamidated form, or a deletion sequence of similar hydrophobicity. Whether the shoulder is counted against purity depends on the integration settings, and resolving it needs a shallower gradient, a different column, or two-dimensional LC with mass spectrometry.
Why do impurity peaks appear before or after the main peak?
Reverse-phase HPLC elutes in order of hydrophobicity. Oxidized methionine (+16 Da) and species that lost a hydrophobic residue are more polar and elute earlier; tert-butyl adducts (+56 Da), hydrophobic insertions and disulfide dimers elute later. D-isomers and deamidated forms sit very close to the main peak on either side.
Can an HPLC chromatogram show a false impurity?
Yes. Ghost peaks from column contaminants, system peaks at gradient changes and carryover from the previous sample all appear without being in the sample, which is why a blank run is reported. The column itself can oxidize methionine during the run; one 2021 study measured up to 56% artefactual oxidation on an aged column.
Citations
- United States Pharmacopeia. General Chapter <1225> Validation of Compendial Procedures. USP-NF. doi.usp.org/USPNF/USPNF_M99945_04_01.html
- FDA. Q2(R2) Validation of Analytical Procedures: Guidance for Industry. 2024. fda.gov
- D'Hondt M, Bracke N, Taevernier L, et al. Related impurities in peptide medicines. J Pharm Biomed Anal. 2014;101:2-30. PMID 25044089
- Lian Z, Wang N, Tian Y, et al. Characterization of Synthetic Peptide Therapeutics Using Liquid Chromatography-Mass Spectrometry: Challenges, Solutions, Pitfalls, and Future Perspectives. J Am Soc Mass Spectrom. 2021;32:1852-1860. PMID 34110145
- Petersson P, Buckenmaier S, Euerby MR, Stoll DR. A strategy for assessing peak purity of pharmaceutical peptides in reversed-phase chromatography methods using two-dimensional liquid chromatography coupled to mass spectrometry. Part I: Selection of columns and mobile phases. J Chromatogr A. 2023;1693:463874. PMID 36841023
- Stoll DR, Sylvester M, Euerby MR, Buckenmaier S, Petersson P. A Strategy for assessing peak purity of pharmaceutical peptides in reversed-phase chromatography methods using two-dimensional liquid chromatography coupled to mass spectrometry. Part II: Development of second-dimension gradient conditions. J Chromatogr A. 2023;1693:463873. PMID 36871316
- Baumans F, Hanozin E, Baiwir D, et al. Liquid chromatography setup-dependent artefactual methionine oxidation of peptides: The importance of an adapted quality control process. J Chromatogr A. 2021;1654:462449. PMID 34399143
- Wang J, Berglund MR, Braden T, et al. Mechanistic Study of Diketopiperazine Formation during Solid-Phase Peptide Synthesis of LY3298176. ACS Omega. 2022;7:46809-46824. PMID 36570276
- Cheng Y, Wu P, Kan Y, et al. Identification and determination of structurally related peptide impurities in thymalfasin by liquid chromatography-high-resolution mass spectrometry. Anal Bioanal Chem. 2022;414:8035-8045. PMID 36207535
- Liu W, Zhu H, Wang Y, et al. Possible origin and suppression of apparent +56 Da impurities during peptide synthesis. J Pharm Biomed Anal. 2027;282:117720. PMID 42705141
- Li M, Josephs RD, Daireaux A, et al. Structurally related peptide impurity identification and accurate quantification for synthetic oxytocin by liquid chromatography-high-resolution mass spectrometry. Anal Bioanal Chem. 2021;413:1861-1870. PMID 33479819
- Strege MA, Oman TJ, Risley DS, Muehlbauer LK, Jalan A, Lian ZY. Enantiomeric purity analysis of synthetic peptide therapeutics by direct chiral high-performance liquid chromatography-electrospray ionization tandem mass spectrometry. J Chromatogr B. 2023;1219:123638. PMID 36857849
This article is for laboratory research reference only. US Prime Peptides products are supplied strictly for in vitro research. Not for human consumption.
Related research
- HPLC Purity: What 'Area Percent' Does and Does Not Tell You
- LC-MS Identity Confirmation: What the Mass Spectrum Proves About a Peptide
- What a Peptide Certificate of Analysis Does Not Test For
- TFA Salt vs Acetate Salt: Why the Counter-Ion on a Peptide Matters
- How to Vet a Research Peptide Vendor: A 12-Point Checklist
Compliance Notice: US Prime Peptides products are supplied strictly for laboratory and academic research purposes only. They are not intended for human or veterinary consumption, diagnosis, treatment, or prevention of any disease. All content on this page is educational in nature and does not constitute medical advice or product claims. Researchers are responsible for handling these compounds in accordance with their institution’s safety protocols and applicable laws.